
There are loads of SEO tools out there, but Google Search Console remains one of the most valuable.
This free tool, created by Google, displays invaluable data about how your site performs in the search engine. If you want to guide and optimise your SEO strategy or update your site, then Search Console is a go-to for any website owner or marketer. In fact, you’ll be hard-pressed to come across a content marketer that doesn’t have at least one Search Console tab open on their laptop at any given time.
In this guide, we’ll cover everything you need to know about using Google Search Console. This includes getting started on the platform, as well as some of the best strategies and metrics you can apply to your website.
What is Google Search Console?
Google Search Console (GSC) is a free platform that lets you monitor how Google views your website. The platform provides valuable information on your website’s health and performance in relation to Google Search.
Anyone with a website can use Google Search Console to access metrics about their site’s performance in search results, as well as the user experience their site offers. It’s an incredibly important SEO tool for gaining macro and micro insights for your website.
You can use GSC to understand things like the overall impressions your site gets over a period of time, your mobile site performance, what search queries specific pages are getting, your most popular pages, Core Web Vitals performance, and more.
Quite simply, if you want to improve Google Search performance and attract more traffic to your site, then Search Console is an indispensable tool.
How to Add Your Site to GSC
The first thing you need to do when getting started with GSC is adding your website to the platform.
First, log into Google Search Console and enter your homepage URL into the domain field.
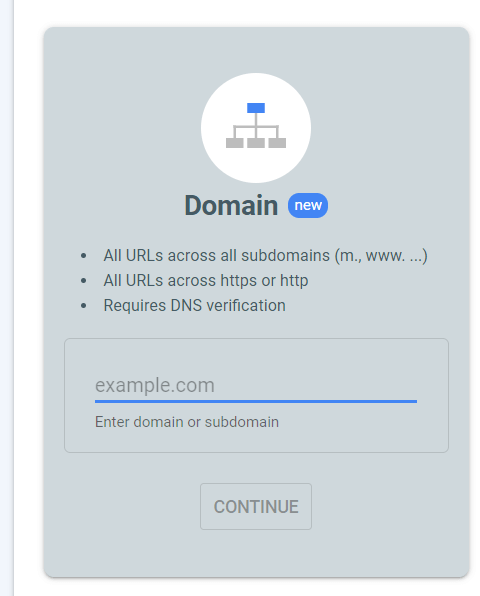
Then you will need to verify site ownership. You have seven different options for doing this, but here are the four easiest ways:
- HTML code snippet: All you do is add an HTML tag, which is a small section of HTML code, into the <head> section of your homepage code
- HTML file: You upload a unique HTML file to your site to verify ownership
- Google Analytics tracking code: You copy a Google Analytics tracking code which you already are using on your website. You will need to have “edit” permission on Google Analytics to do this.
- CNAME or TXT record: This involves adding a special CNAME or TXT record to your site’s domain settings
Once your site has been verified, the next step is to select your target country (an optional step). While GSC does a good job of determining this automatically, it’s still a good idea to provide the extra information. The more details you can give GSC, the better.
To select your target country:
- Click on International targeting (under Search Traffic)
- Select the Country tab
- Check the Target Users in box and select which country this applies to from the drop-down box
Now you’re all ready to get started with Search Console.
GSC Owners and Permissions
Before you start using GSC, its important to understand the two different role types available on the platform:
- Owner: An owner has complete control over the website in GSC. Owners can access every tool, add and remove other users, access all data on the site, and change settings. Verified owners have completed the website verification process (above), while delegated owners have been added by verified ones.
- User: Users are added by owners and they can see most of the available data. Users cannot add new users.
If you provide access to your website’s GSC account to a team, be very careful about who has owner and user permissions. The last thing you want is for a user to accidentally change an important setting on your website.
Understanding GSC Metrics
Before using GSC, you’ll need to understand the different terms, metrics, and dimensions that you see on the platform.
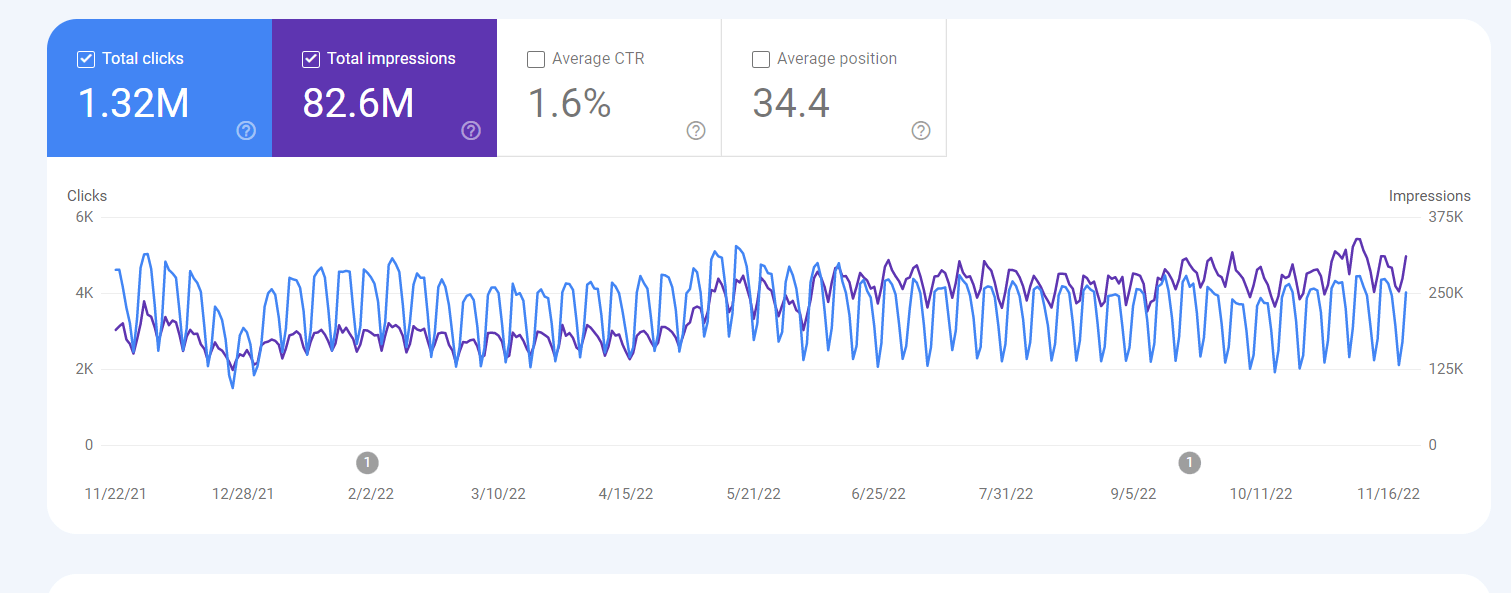
- Impression: Whenever a link URL of your website appears in a user’s search result
- Query: The specific search term used to generate an impression of your site in Google SERPs
- Click: When a user clicks on your URL that takes them away from Google Search. Clicks happen after impressions. This metric doesn’t include Google PPC ad clicks
- Average position: The mean ranking of a page for its search queries. This metric considers what queries a page is getting and determines the average position your page is ranking for based on these queries
- CTR: Click Through Rate (CTR) is a web page’s number of clicks divided by its impressions, and then multiplied by 100. This percentage reveals how many people click on your page in relation to how many people are presented with your page in search results.
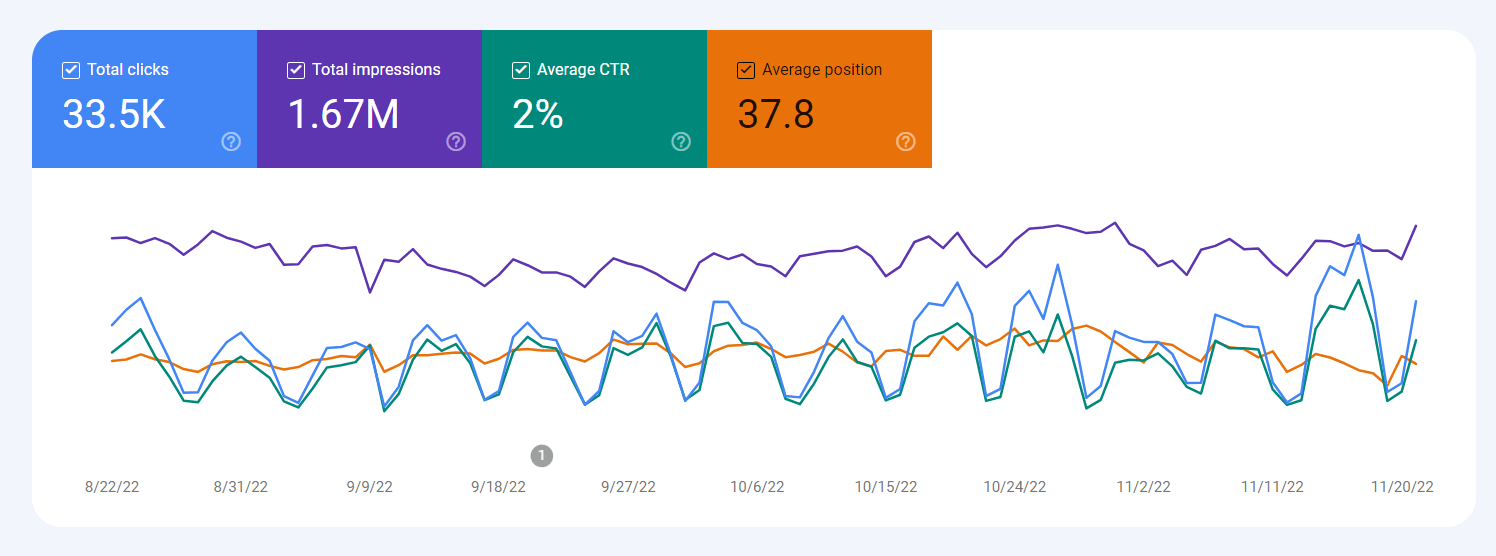
As you can see from the image above, these metrics are displayed as numbers (over a date range) and as lines on a graph in different colors. This helps you understand the specific performance metrics of different pages on your site.
Google Search Console Filters
An essential part of using Google Search Console is filtering and viewing data.
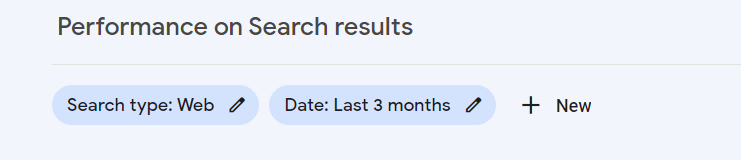
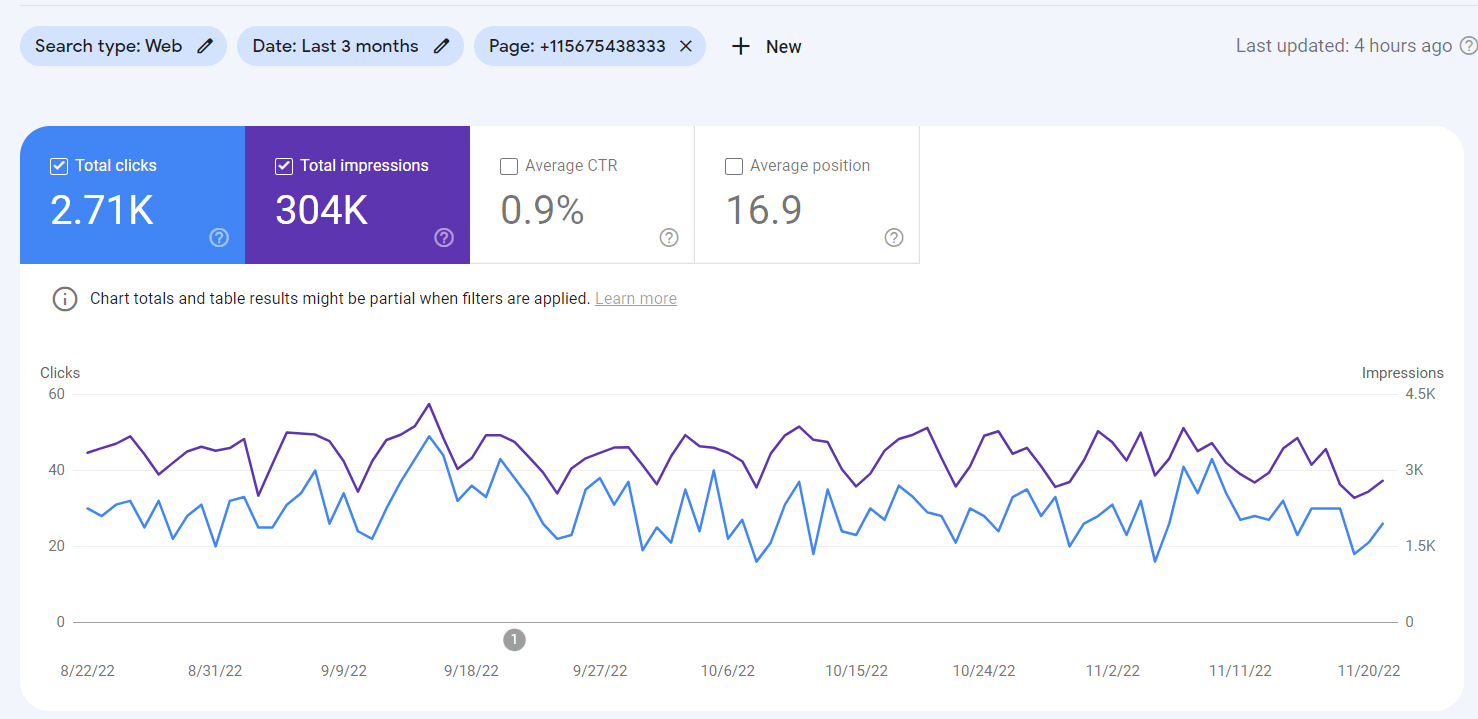
Here is a basic report of a website’s performance on Google Search Console:

In the top left corner, you can see your filters. Right now, only two filters are applied (Search type and Date)
Using the available filters helps you customize your GSC report to access more specific information on your site.
Search Type
You can choose between three different search types:
- Web
- Video
- Image
Most websites will just stick to web searches, as this is where most of their traffic comes from. If gaining traffic from video or image searches is important to your site, then be sure to look at these search options.
You can also compare the different search types for specific posts to see how your sources of traffic compare.
Date Range
When searching for data on GSC, you can go back 16 months on your site. You can either select a custom date range or choose from pre-set time periods. You can also compare performance from two different date ranges.
Other Search Filters
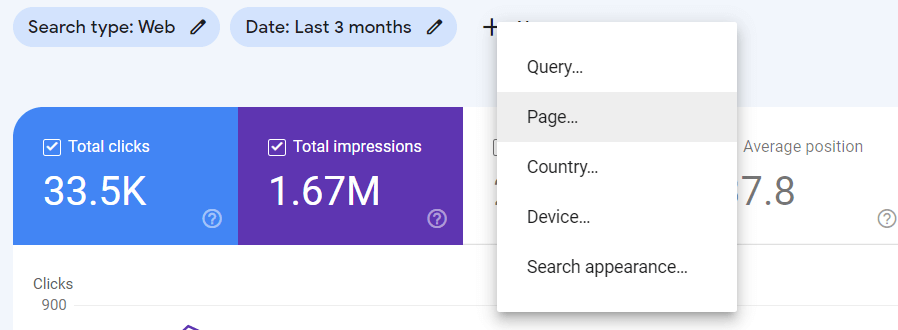
Click on the +New button next to the date range, and this will let you add five additional types of filters.
- Query: The performance of a specific search query on your website
- Page: the performance of a specific page
- Country: How your website or pages are performing for a specific country
- Device: How your website is performing based on the type of device
- Search Appearance: How your pages are performing in search appearances
You can layer these queries to help you gain more detailed insights on specific pages and performance aspects of your site. For example, you could search for search queries related to a specific page. Or, you could search for a specific query and compare how popular it is against mobile and desktop devices.
Play around with these filters to see just how many possibilities exist for understanding your website’s search performance.
One important filter to understand is the Page filter. To use this, select the Page option:
And then add the entire URL (if Exact URL is selected) or add the unique digit code in your URL (if URLs Containing is selected), like this:
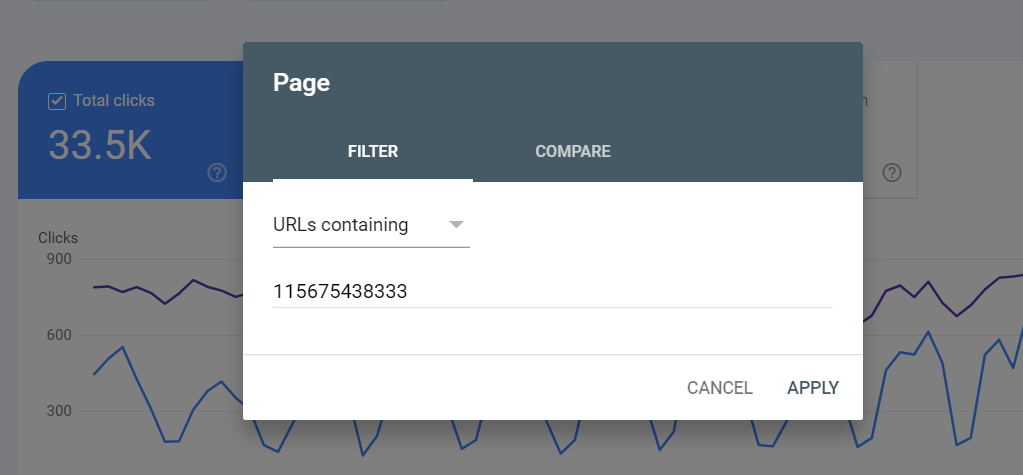
Click Apply and now you can gain a custom report for that individual page:
Adding additional filters to that report will provide page-specific insights.
Now that you understand these basic filters and metrics, you can gain the most important search results insights you need to know from any page on your website using GSC.
Troubleshooting With GSC
In order to rank well in Google search results, Google will have to crawl and index pages on your website. Search Console offers a tool that inspects URLs to let you discover any possible crawling or indexing issues before they start impacting your site.
URL Inspection Tool
The URL Inspection tool reveals whether a URL on your site is indexed and can be displayed in a Google search result. When a URL on your site is submitted, you can use this tool to:
- Request indexing. This is useful for any recently updated pages
- See the last crawl date of that URL
- See how Google discovered the web page (referring URLs and sitemaps)
- Check your mobile usability status
- See if Google is using a canonical URL
Coverage
The Coverage section (accessible from the menu on the left) in GSC shows:
- Discovery: Reveals how Google discovered the URL
- Crawl: Reveals whether Google crawled the URL
- Enhancements: Shows how structured data is used on the URL
Coverage Error Reports
Coverage error reports display possible issues on URLs, or areas where indexing can be improved. This could include errors like URLs being blocked from Google crawl bots. 404 Errors are another common example. Your site might also have penalties.
Whatever the issue, the error will display an error code and a short explanation of what this means.
The report will display a list of all affected URLs which you can click on to inspect.
When running an index coverage report in GSC, each page will have one of four possible statuses:
- Error: This is when the page could not be indexed
- Warning: This is when the page is indexed, but there is a problem with the page
- Excluded: This is when you have purposefully excluded the page from being indexed. This happened when you use a canonical page for indexing because the excluded page contains duplicate content
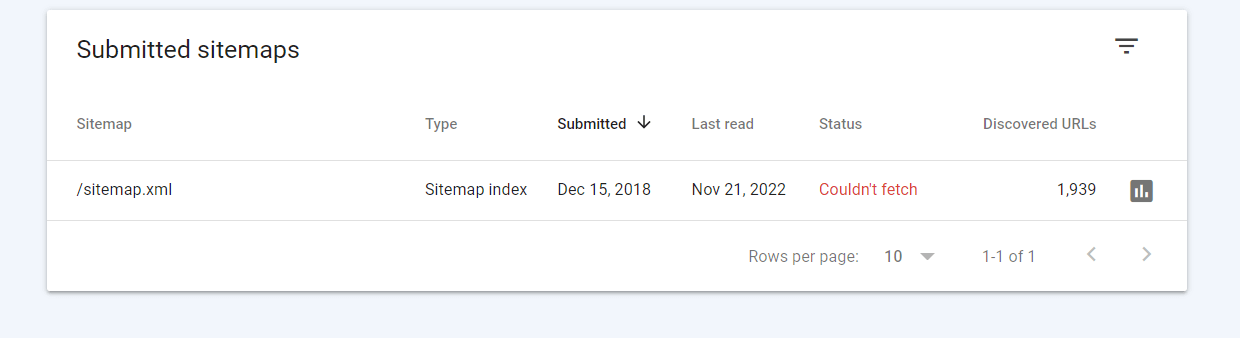
Submitted Sitemaps
The Submitted Sitemaps section is where you can add your sitemap to make it available to Google. This section also displays the current status of your sitemap.
A sitemap isn’t a necessity for getting your pages into the SERPs, but it does make it easier for Google bots to crawl your site. A sitemap makes it easier for Google to find all of the pages on your site, as well as to format and display your website information in search results.
If you have a very large website, or if your site has a lot of isolated pages and poor internal linking structure, then implementing a sitemap is a good idea.
How to Use Google Search Console
We’ve covered the basics of how Google Search Console works and how you can access information. Now it’s time to explore some of the strategies you can use with this platform.
Identify Your Most Popular Pages
One of the most useful applications of GSC is to identify the top-performing content on your site. This is particularly useful for blogs with a lot of published content.
Here are some of the ways you can achieve this.
Highest-Traffic Pages
To identify the pages on your website that get the highest traffic:
- Click on Performance
- Select the Page tab
- Set the date range. We recommend setting this to 12 months, as a full year will provide the best traffic insights
- Select Total Clicks in the report metrics
- Scroll down below the graph and you will find a list of your most-clicked-on pages. You can sort these from highest to lowest amounts of clicks by clicking on the downward arrow placed next to Clicks
Highest-Ranking Pages
To identify the highest-ranking pages on your website:
- Click on Performance
- Select the Page tab
- Set the date range. We recommend keeping this relatively short (last 28 days) to gain an up-to-date overview of how your site is currently ranking
- Select Average Position in the report metrics
- Scroll down below the graph and you will find a list of your pages. Click on the upward arrow next to Position to sort the pages from est to worst ranking
One important thing to point out with the Average Position metric is that it calculates a mean position based on the search terms that the page is ranking for.
For example, the page might be ranking at position #1 for a high-volume keyword, and ranking at position #20 for a low-volume keyword. The average position will be 10, even though the page is at the top spot for a valuable keyword.
So, always look at the Average Position metric alongside other metrics for a better understanding of the page’s performance.
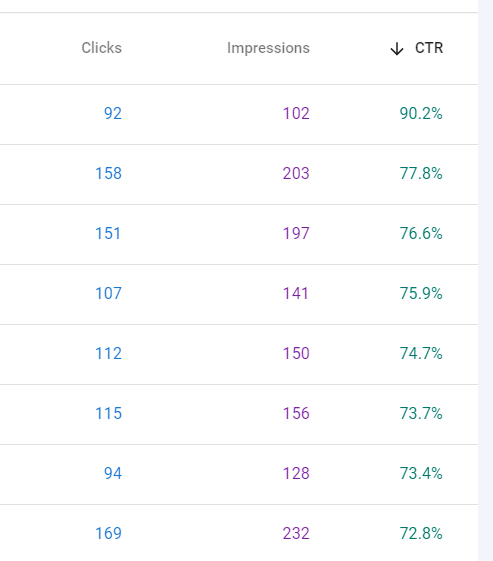
Highest-CTR Queries
To identify which search queries are resulting in the highest CTR on your website:
- Click on Performance
- Select the Queries tab
- Set the date range. We recommend setting this to the last 12 months, as a full year will provide a better overview of your CTR results
- Select Average CTR in the report metrics
- Scroll down below the graph and you will find a list of your top search queries. Click on the small arrow next to CTR to rank these from highest to lowest
You could also select the Clicks and Impressions metrics to gain a better understanding of how the page is actually performing. If your page is getting a high number of impressions but has a low CTR, then you might want to update the page – particularly the title and meta description. This could help boost your CTR where there is a lot of opportunity.
You can also use GSC to monitor your average CTR or your CTR over a certain time period. This is achieved by changing the filter options and date ranges.
Monitor Your Impressions
GSC makes it easy to gain an overview of your website’s impressions. If you’re regularly publishing new content on your blog, then your impressions should steadily increase over time. If your impressions start to drop, it’s important to identify what caused this.
Maybe you started targeting lower-volume keywords, or maybe your pages have not been indexed. These are common causes for declining impressions.
You should also monitor your website’s clicks alongside impressions over these time periods. The relationship between clicks and impressions should generally stay the same. Your impressions will always be higher than your clicks.
Again, understand what caused any sudden increases or drops in clicks.
Explore Your Search Queries
You’ll definitely want to know which search queries are bringing in the most traffic to your website. To do this:
- Click on Performance
- Select the Query tab
- Choose your date range
- Select the Total Clicks metric
- Scroll down to the list of queries and click on the arrow next to Clicks to sort them from highest to lowest. This will reveal which search queries are sending the most traffic to your website
It’s also incredibly valuable to look into the search queries of specific pages after you have published them. Generally, it takes about two weeks to one month for your pages to get indexed and start ranking. Try to go back to your pages after you have published them to see what search query they’re ranking for.
This is interesting because pages often rank for queries that are slightly different from your initial target keyword. If you get a lot of impressions for a new search query, then you can optimize and update your page based on this search query. Doing so can help you gain more clicks for a potentially high-traffic search term.
Understanding your highest-traffic search queries is also important for gaining useful insights into your audience and their interests. You can apply this to other areas of your digital content strategy.
Identify Google Updates
Another helpful thing to identify in GSC is Google algorithm updates. You can see the date of the update event displayed as a 1 on your performance graph:
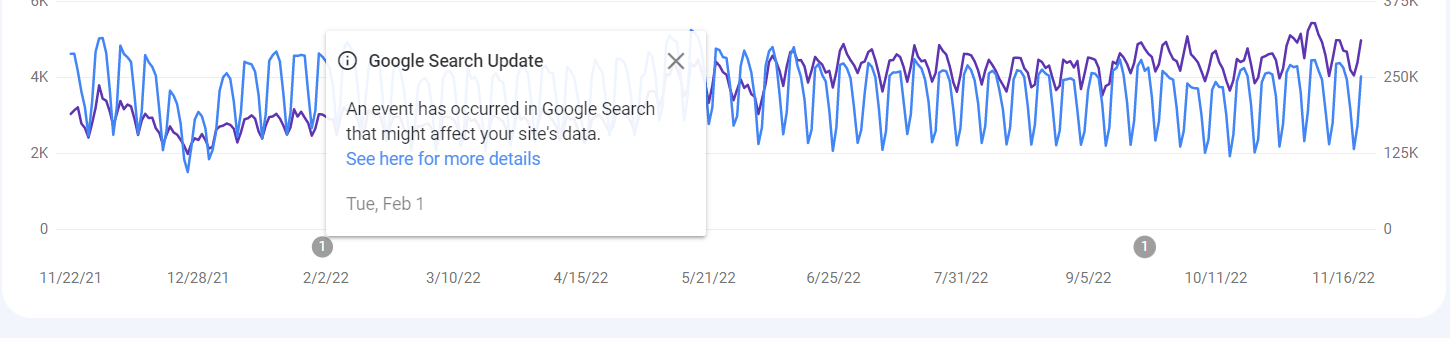
Click on the link for more details about the update or event.
Identifying this is important if you see a significant change in clicks, position, or impressions from that date. This would likely mean the update affected your rankings.
Monitor Page Indexing
Understanding how your pages are being indexed is an essential part of any SEO strategy. Here are some page indexing insights you can gain from Google Search Console.
See How Many Pages Have Been Indexed
To see how many pages on your site are indexed by Google:
- Start an Overview
- Scroll down to Indexing and click on Full Report
- Now you can see how many pages are indexed and how many are not
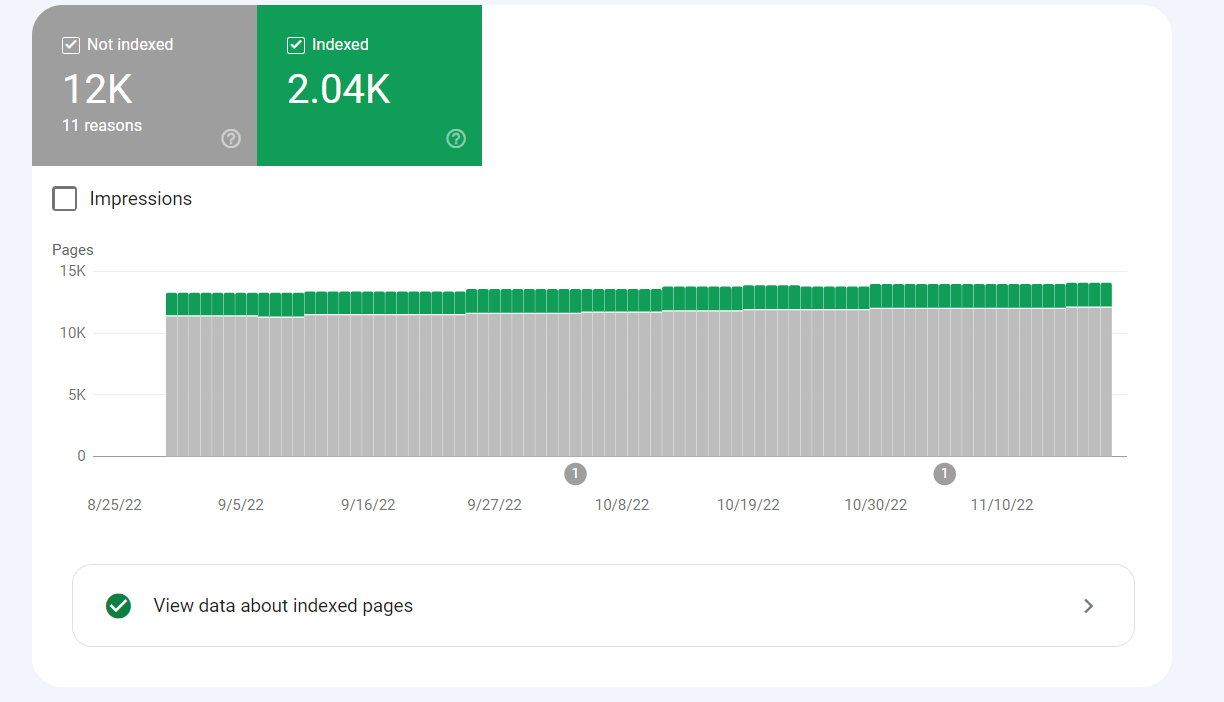
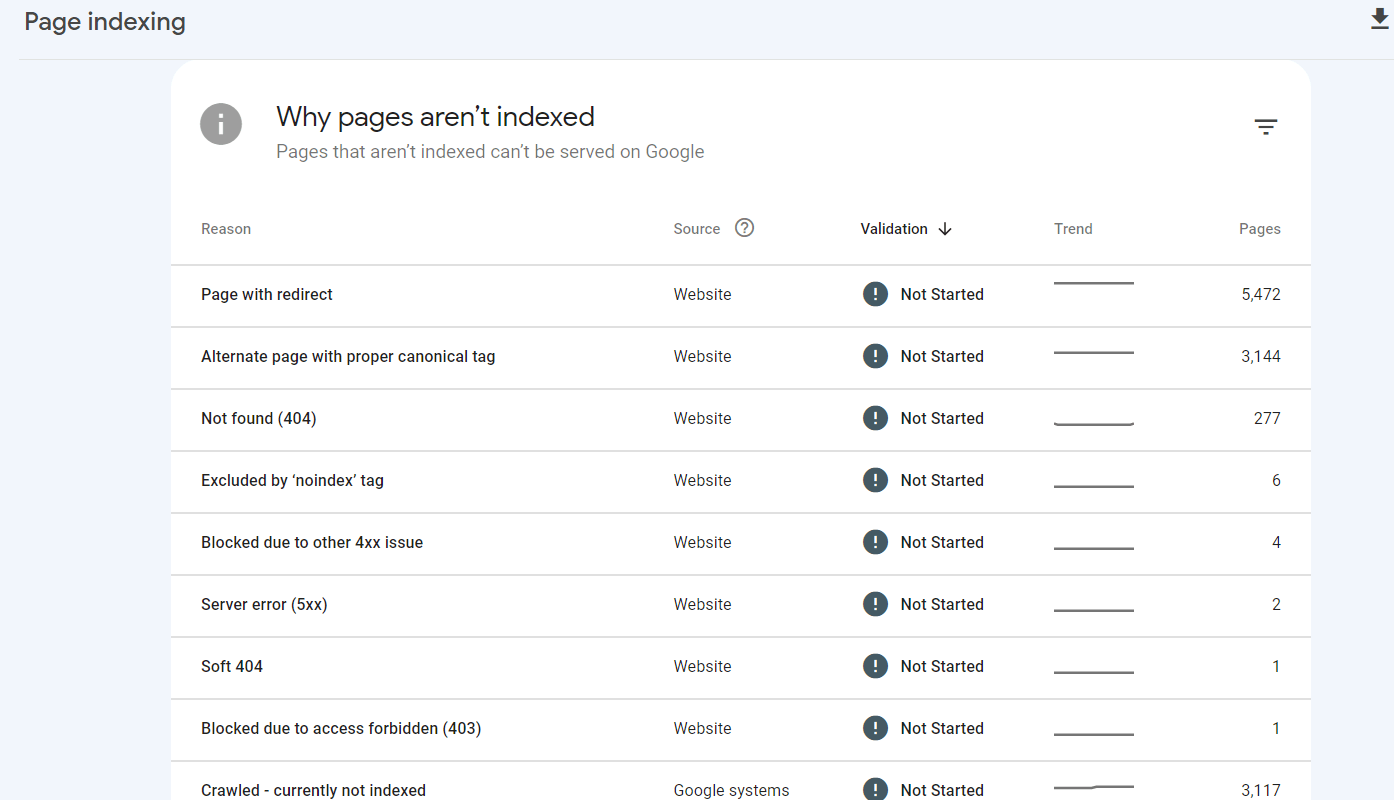
When you scroll down you can see the reasons why these pages are not indexed. They may not always be errors or issues.
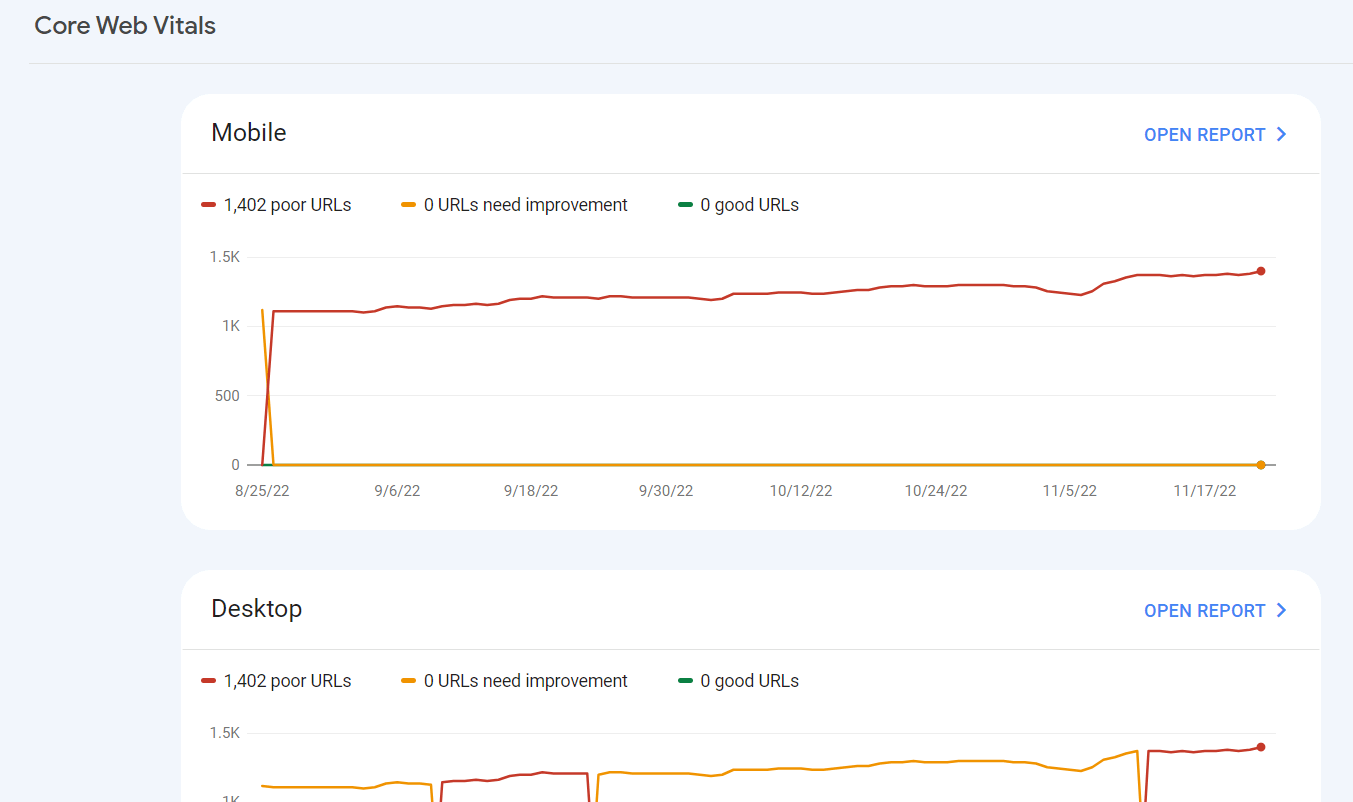
Core Web Vitals
Core Web Vitals are a significant ranking factor for Google. These are metrics that affect the user experience on pages.
Any issues present on your Core Web Vitals report should be fixed, as this will have a direct impact on your website’s organic performance.
To access these reports, click on Core Web Vitals under the Experience section in the left-side menu. You will be presented with two reports – one for mobile and one for desktop. Click on each report for more detailed insights.
Links
Search Console provides a links report that shows a list of all the links pointing to your website. This includes reports on external and internal links.
Unfortunately, the report does not reveal nofollow and dofollow links, it only includes all links – so you’re not always certain about which links are helping your website rank.
The External Links section reveals three different reports:
- Top linked pages
- Top linking sites
- Top linking text
The Internal links report only reveals the top linked pages.
This is a useful tool for gaining a high-level overview of your website’s link performance to guide your linking strategy. However, you can only see the main domain of the site linking to you and not the exact page.
Rich Results
You can access information on your site’s rich results through GSC’s Performance report. You can access this by selecting the Search Appearance tab on the report. This reveals how many clicks and impressions you get for certain rich results that are shown in the SERPS.
You can also use the Search Appearances report to identify any structured data issues that exist on your site. If you are optimizing your website with schema markup, then monitoring this report is important.
Summary
Monitoring your website performance and knowing when to make updates and changes to your site is an essential part of any SEO strategy. Google Search Console is possibly the most valuable tool for letting you do this.
By keeping a close eye on the right search metrics and understanding how your site is performing, you’ll be able to continually optimize your SEO efforts. The results? Higher rankings in Google and increased traffic!